What the District?!
An interactive data visualization from the ACLU, focused on raising awareness of redistricting and gerrymandering
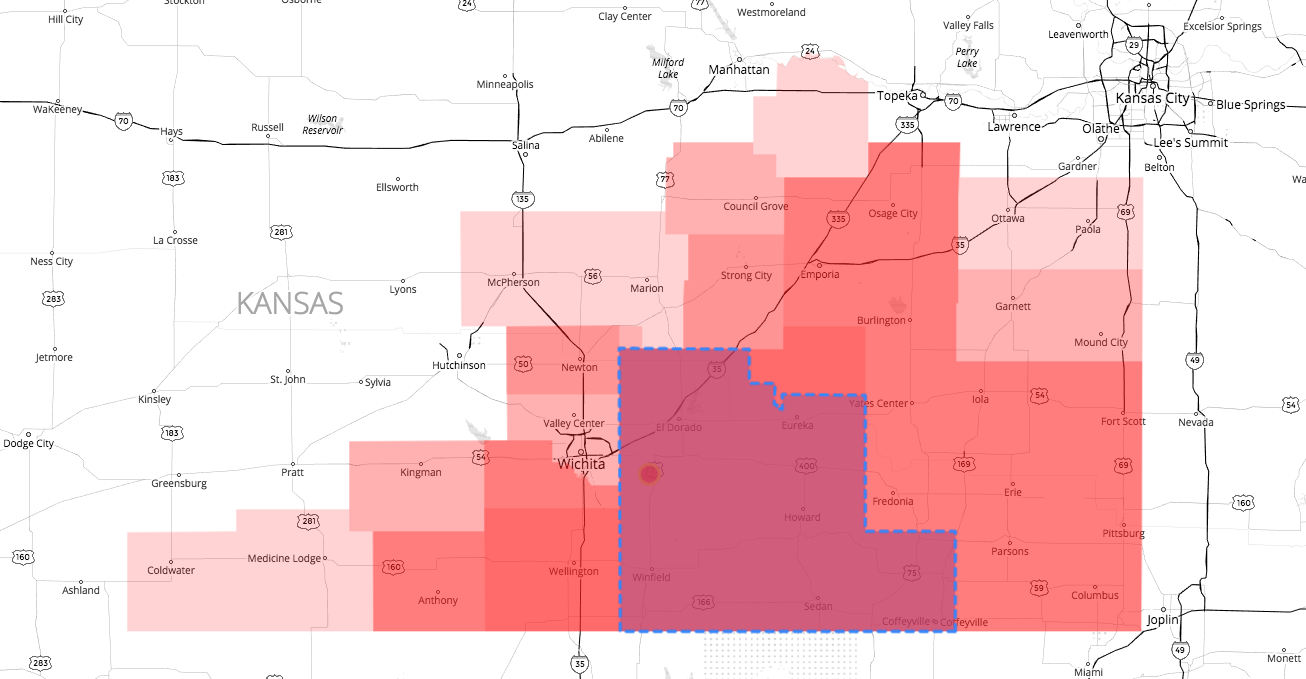
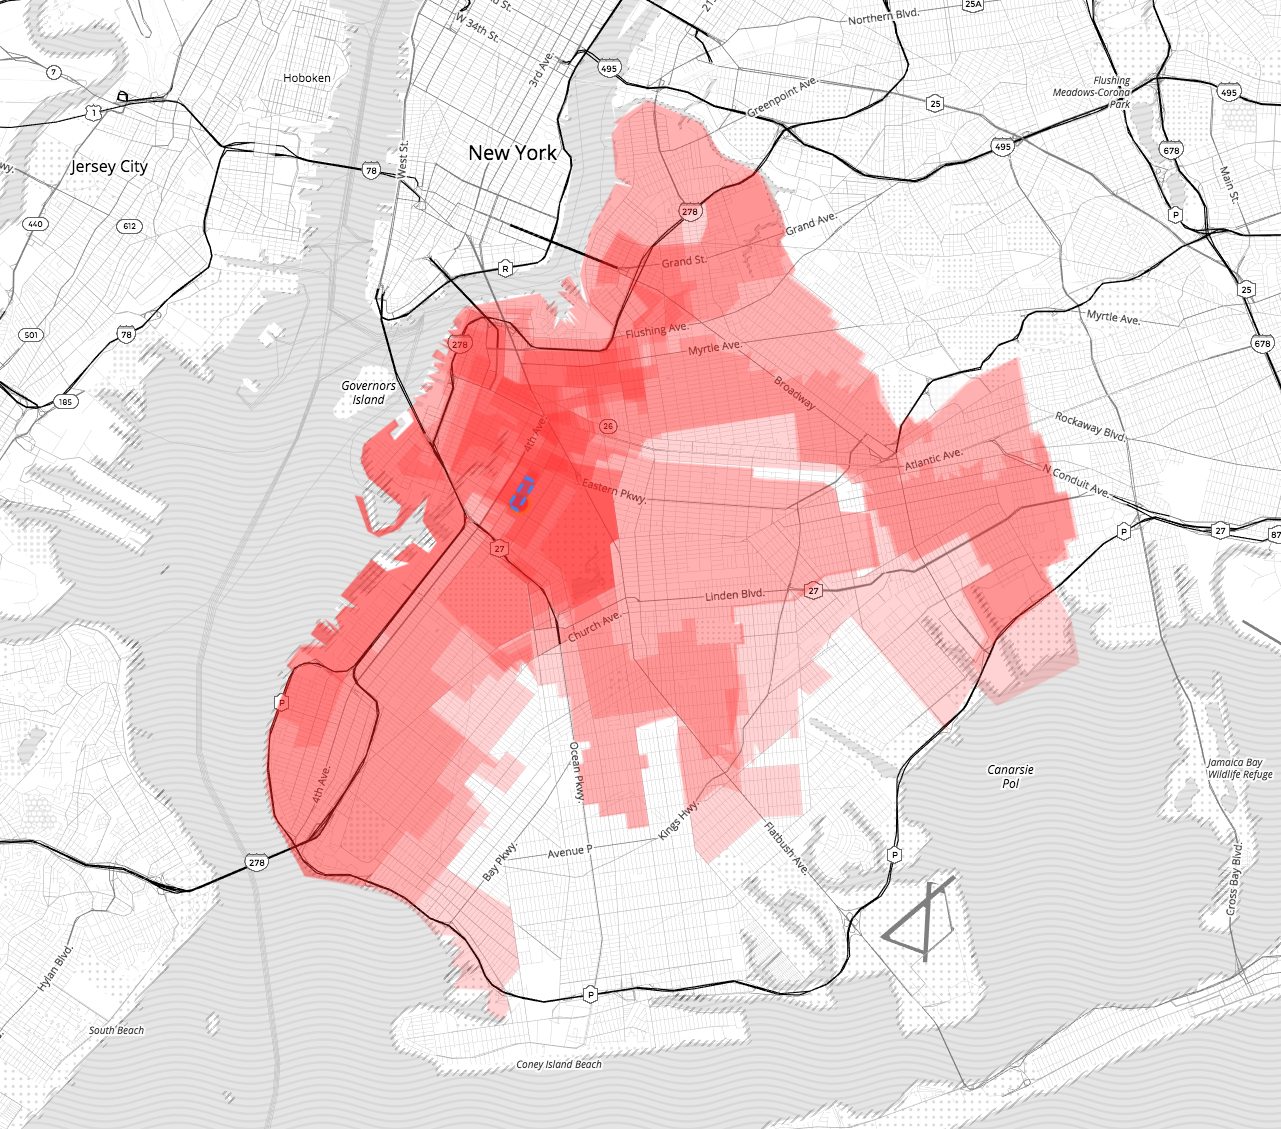
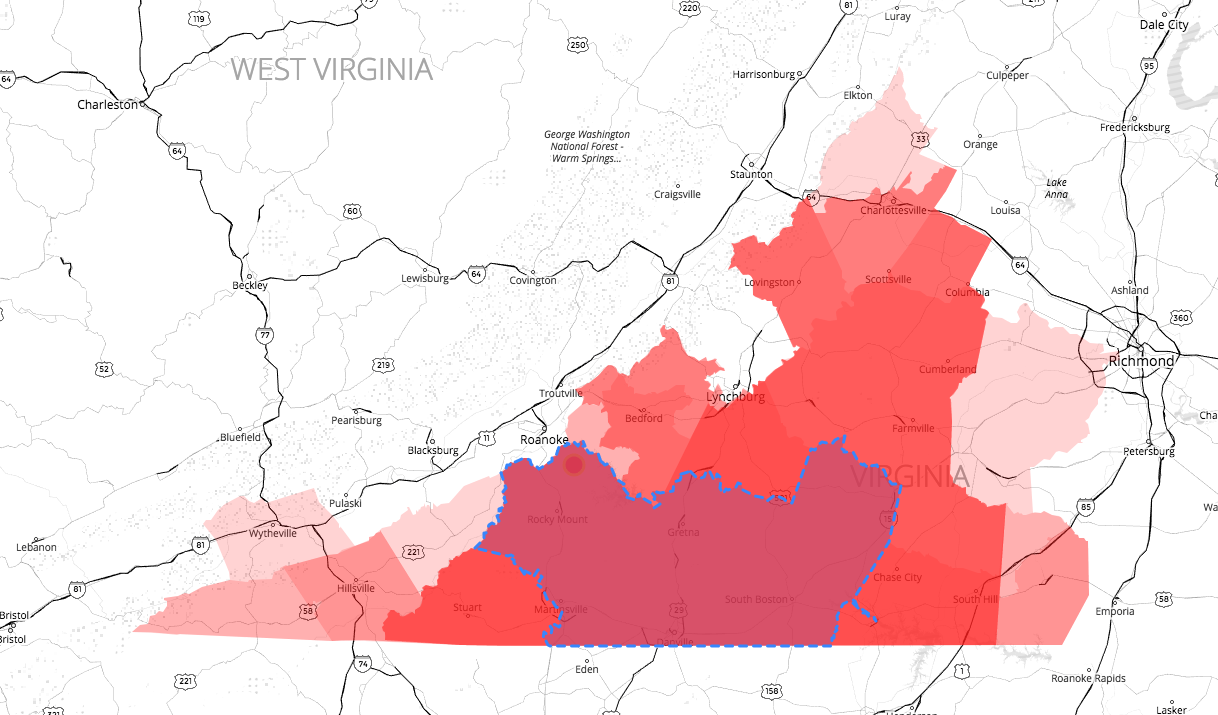
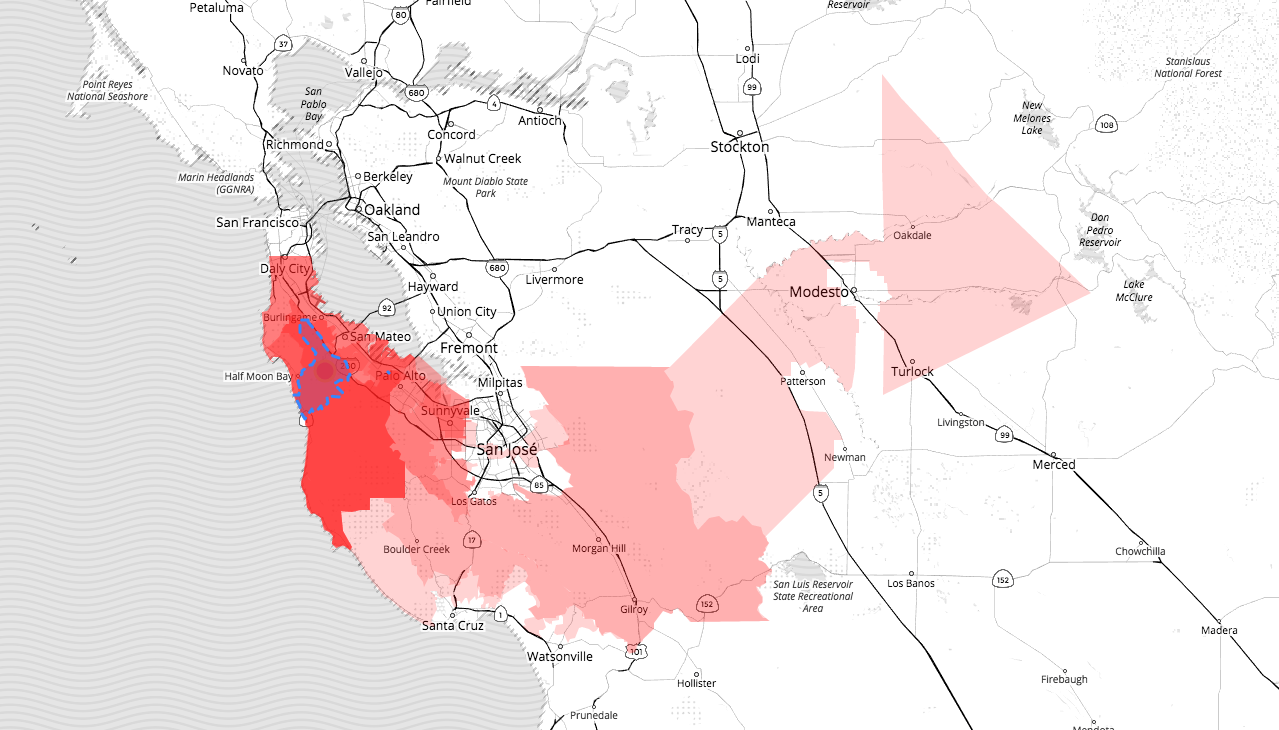
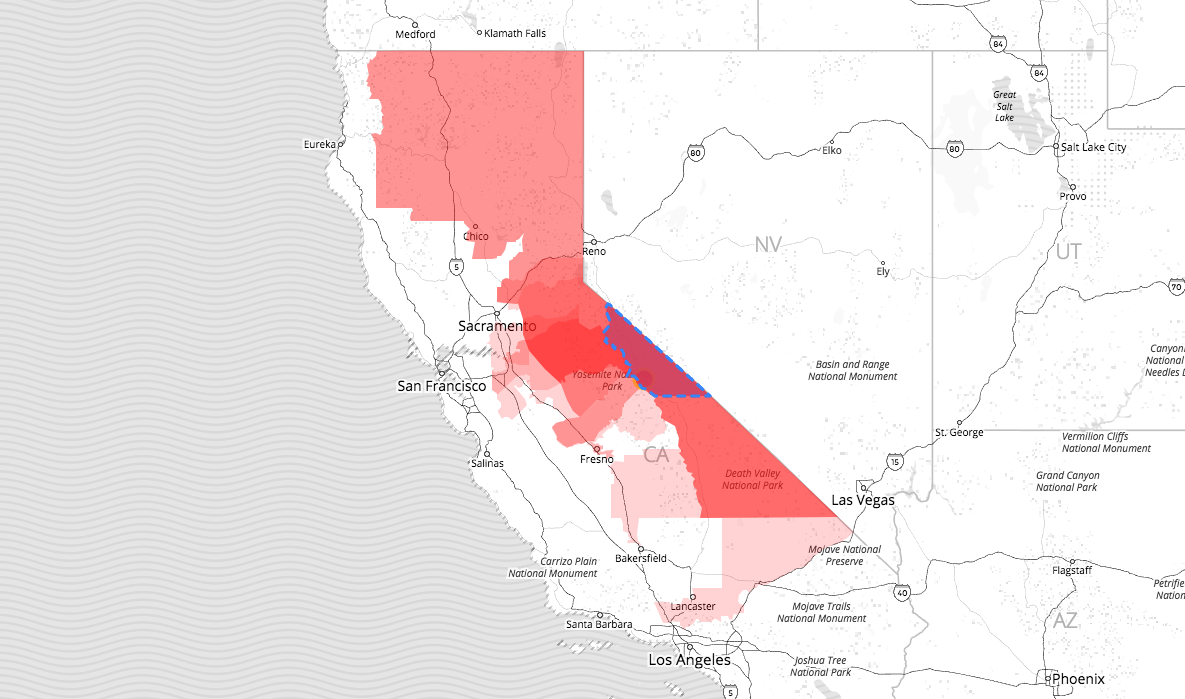
See how the congressional district shape for any U.S. address has changed since 1960

Constituents can share their own district history on social media, with dynamically generated small multiples:

From the research phase — district intersections over time reveal areas that have shared continuous congressional representation:
Tangram
Real-Time Rendering for Creative Cartography
Mapzen’s cross-platform, open source WebGL/OpenGL map rendering engine — Github
Highly customizable real-time mapping through JavaScript styling functions and GLSL shaders
YAML-based syntax for selecting and styling data, modular for composing and remixing across maps
Support for complex text shaping for Arabic, Indic scripts, etc.
Over 1,400 stars on Github for the JS library and 2,500 across projects
Adopted by the Linux Foundation in January 2019
Some of my favorite things we made with Tangram…
Bubble Wrap
Worldwide basemap filled with street-level detail — open live map ➹
Over 950 road shields for US states and international motorways, and 670 points of interest icons
Backed by Tilezen, vector tile service for all zoom levels across the globe, curated and simplified data from several open sources


Terrain Rendering
With our unique "spheremap"-based lighting technique for real-time hillshading, we explored how elevation data could be visually and computationally remixed in the browser:

Calculating standard deviation of slope in the browser — finding ridges for terrain generalization:

Adaptive heightmap viewer that maximizes level of detail by resampling based on values in the current viewport — open the demo and try moving the map!

Hillshading over historical topo maps — open the demo and slide cursor to reveal/hide:

Themes & Levels of Detail
User-controlled variables for map appearance — color theme, language preference, transit overlay, bathymetry toggle, and so on
Level of Detail controls for feature and label density
